Pandemica: Agent-Based Pandemic Simulation for Optimal Public Health Crisis Management Using Adaptive Demographic Modeling
Departament of Data Processing - Colégio Técnico de Campinas - Universidade Estadual de Campinas (Unicamp)
Abstract
Since the outbreak of COVID-19 in late 2019, the world has faced unprecedented global impacts, including millions of deaths and ongoing economic, political, and social crises. With new potential pandemics like monkeypox emerging, developing effective methods to predict and mitigate epidemic impacts is increasingly critical. This study introduces an innovative agent-based simulation model that uses a neural network-like algorithm to assign demographic and economic data to agents and simulate individualized behavioral routines. This approach enhances the accuracy of current epidemiological predictions by adapting to real-world data on a city scale.
The model is open-source, accessible, and designed for local health departments. It requires only basic epidemiological knowledge and standard computing resources. Users input demographic data from agencies like the Brazilian Institute of Geography and Statistics (IBGE) and disease characteristics to simulate city-specific disease spread. Public health officials can adjust parameters such as mask-wearing and vaccination rates, providing actionable insights to minimize loss of life and optimize resource allocation.
In our preliminary results, the model successfully recreated a virtual representation of Campinas, São Paulo, with a population of 1,164,099 individuals. In about two hours, it had simulated 1,020 days (or roughly 3 years), spanning from early 2020 to late 2022, projecting 289,943 cases and 7,752 deaths compared to real-world data of 209,500 cases and 5,360 deaths, achieving an accuracy of 58.48% based on Mean Absolute Percentage Error (MAPE). Already adopted by health departments in Campinas and Bragança Paulista, both in São Paulo, the tool serves as a reliable, city-scale resource for managing public health crises, reducing impacts on human life and economic stability.
Introduction
The world has been suffering from the consequences of the COVID-19 pandemic since the end of 2019, when the virus began to spread from the city of Wuhan, Hubei province, in the People's Republic of China. The World Health Organization (WHO) estimates that the total number of deaths directly and indirectly associated with the COVID-19 pandemic (described as "excess mortality") between January 1, 2020, and December 31, 2021, was approximately 14.9 million (ranging between 13.3 million and 16.6 million).
Globally, various prevention and containment measures were implemented, such as social distancing, quarantine, lockdown, and subsequent vaccination (ARBEL; PLISKIN, 2022), significantly mitigating the spread of the virus. With the emergence of new potential pandemic pathologies (JONES et al., 2008), such as the recent monkeypox (SOHAL et al., 2023), for example, there is an opportunity to use technology to implement accurate simulation models (COSTA; PEIXOTO, 2020) to discover preventive and remedial measures to mitigate the human, economic, and social impact caused by pandemics (FU et al., 2021).
Countries like South Korea, for example, integrated digital technology into government-coordinated containment and mitigation processes—including surveillance, testing, tracking of contaminations, and strict quarantine—that may be associated with the early flattening of the COVID-19 case incidence curve in the country (FERRETTI et al., 2020). It is increasingly evident the important role of implementing public health-related technologies and the remarkable discovery of strategies and responses to pandemics in innovative ways (WHITELAW et al., 2020).
This project aims to propose a simulation model based on the theory of cellular agents combined with probabilistic mathematics as a means to simulate populations whose individuals interact virtually, taking into account the aspect of disease spread. To create and validate this model, it is proposed to use the data obtained during the COVID-19 pandemic and the viral characteristics of the disease.
In the proposed model, we argue that it is not only possible to simulate the pandemic scenario, predicting the number of cases and deaths but also to study different containment and mitigation parameters, such as different uses of masks, social distancing, and vaccination, for example. In this way, it is possible to determine how each variable influences the overall pandemic scenario, allowing competent entities to know how each measure contributes to the fight against emerging diseases, and for the population to more clearly understand how their actions affect the pandemic as a whole, in order to better weigh them.
Research problem
How to propose a reliable pandemic simulation, incorporating characteristics of the virus and its spread among a population, capable of generating different hypothetical scenarios based on changes in virus mitigation and combat variables, leveraging the most of city-scale data?
Hypothesis
The use of cellular agents has great potential for simulating large populations of virtually living individuals (WHITE, 2007), who possess some form of intelligence, making the modeling of a virtual epidemic technically feasible. By adopting relevant and pertinent mathematical relations (WILLOX, 2003), biological characteristics, and epidemiological bulletins, in conjunction with suitable technologies, it is expected to establish an effective, accurate simulation model capable of generating pandemic reports that are faithful to the numbers of cases and deaths in various simulated scenarios, compared to the real outspread of the disease within a city-level scope.
Justification
The COVID-19 pandemic has caused significant impact on public health and the global economy since its onset in 2019 (FU, 2021). By the beginning of 2023, the pandemic had caused an estimated global loss of USD 29.4 trillion (VISCUSI, 2023), in addition to impacts on the physical and mental health of the population, and an increase in waste generation (organic and inorganic), which have direct and indirect impacts on the environment, such as air, water, and soil pollution (ISLAM et al., 2016). Events like these result in significantly negative impacts on society and its environment. In this sense, it is extremely necessary that measures be taken to prevent and contain the next major pandemic.
However, although there is extensive literature on the mathematical modeling of COVID-19, studies and models that investigate the simulation of the spread of epidemiological outbreaks at a local level are scarce, considering various factors such as the population and physical characteristics of a given city, combined with general disease data, such as viral and behavioral characteristics. In this way, the impact of potential pandemics can be contained and mitigated on state, national, and international scales by addressing the spread and development of a pathology at the municipal level. In this regard, this study proposes the use of concepts from theoretical computing and mathematics, as well as algorithms and data structures, composing a simple yet robust pandemic simulation paradigm.
This research is relevant as it can provide important information for public managers' decision-making regarding the fight against emerging diseases. Additionally, it can contribute to the global development of more effective pandemic control strategies, considering viral particularities, but mainly regional specifics.
Finally, conducting this research is also pertinent as it expands knowledge on the application of cellular agents in epidemiology and strengthens collaboration between the institution and other organizations working on pandemic themes.
Scope
Human behavior modeling is an extremely complex system due to the diversity and variability inherent in actions and decisions. Humans respond to stimuli influenced by a range of factors, including past experiences, social context, emotions, and health states. Human behavior is adaptive, meaning people can learn and change their behavior over time, making modeling this system in its entirety computationally and mathematically challenging.
Thus, we decided to abstract and simplify various factors in this simulation, such as individual behavior, which, instead of being random, will be a constant defined by a fixed number of limited activities. The city's simulation, also a complex system, required abstraction; therefore, we do not deal with a 100% accurate scenario or all the different activities and places that may exist. However, a wide range of activities has been created to generally encompass all the main actions performed in an urban environment in the 21st century.
We chose to use COVID-19 data for project development and validation as it is the most recent example of a pandemic pathology, with a large availability of data facilitating tests and model validation. Campinas was chosen for the city due to its location as our educational institution and its significance as a major industrial and population center in São Paulo. It's important to note that with census records, virtually any city in the world can be used in the simulation, as data entry is generic.
Objectives
General objective
Create an effective pandemic simulation model that can minimize the impact of potential future pandemics by creating different scenarios that act as awareness tools for competent entities and for the population to act preventively in the midst of a potential pandemic.
Specific objectives
The specific objectives of this research are:
- To incorporate the technical and theoretical foundation of epidemiology;
- Analyze the theoretical base and literature on the viral characteristics of COVID-19;
- Collect geographic and demographic data from Campinas, transposing it virtually;
- Study and develop algorithms based on the behavior of agents suitable for simulating individuals in a virtualized pandemic environment;
- Elaborate the practical implementation of the theoretical foundations of dissemination in a computational model using systemic methodologies and techniques, incorporating epidemiological data;
- Test and evaluate the effectiveness of the system, based on real data collected from epidemiological bulletins, databases, and reports provided by the government;
- Establish a generic pandemic simulation model, capable of simulating the unfolding of a pandemic in any city with Census data and mainly respiratory pathology.
Background
Aiming to promote a better approach to pandemic simulation and, consequently, greater accuracy for the simulation, the system to be developed utilizes the union of various algorithms, concepts of theoretical computer science, and mathematical modeling of disease dissemination to achieve this goal. Therefore, it becomes crucial to understand, primarily, the studies of virus spread analysis, the characteristics of the virus that will be simulated (COVID-19), the field of cellular automata theory in conjunction with existing epidemiological approaches, and their mathematical basis.
Multi-agent systems
Multi-agent systems are systems composed of intelligent agents that are situated in an environment and are capable of interacting to solve complex problems (WOOLDRIDGE, 2009). An agent can be seen as a computer system capable of responding to input stimuli (called perceptions), and through a process of reasoning and planning, generate an output in the form of actions in the environment (WOOLDRIDGE, 2009). The multi-agent system paradigm provides the benefits of: (i) enabling the resolution of complex problems in a distributed manner, without a central processing and failure point, where resources and capabilities are distributed across a network of interconnected agents; (ii) allowing the modeling of systems through the design of autonomous intelligent agents, capable of communicating, as the main component; and (iii) within the context of this work, enabling the simulation of behaviors of complex entities, such as human beings.
Mathematical modeling in disease dissemination
Although it was in Hippocrates' "Epidemics" that the quest for understanding the dynamics of epidemic spread began, Bernoulli is considered a pioneer in the field of mathematical modeling in epidemiology. In his 1760 work, he demonstrated the effectiveness of the variolation technique, which involved the inoculation of benign smallpox to prevent complications from the disease (BERNOULLI, 1760). However, it was in 1927 that Kermack and McKendrick proposed what can be seen as the starting point for the design of current mathematical models (KERMACK; MCKENDRICK, 1927); the SIR model. Different types of mathematical models can be taken into account, depending on the division of the population to be modeled. The mentioned SIR model segments individuals as (ALMEIDA, 2014):
- Susceptible: Individuals who have not yet developed immunity against the infection, meaning they can become infected if exposed to it.
- Infected: Individuals who have contracted the disease and have the capacity to transmit it to susceptible people.
- Recovered: Individuals who have recovered from the infection and acquired immunity, therefore, do not contribute to the spread of the disease.
Many infections have a time interval in which an individual has been infected but does not yet show symptoms or presents an asymptomatic condition; during this time, the epidemiological process is called incubation (ALENE, 2021), the individual is considered exposed. In this case, the SEIR model presents a new class of individuals, characterized by the letter "E" for exposed, in the acronym. Some infections, such as those caused by the coronaviruses responsible for the common cold, do not confer lasting immunity, lacking a defined recovery phase (EDRIDGE, 2020). Therefore, after an infection, individuals become susceptible again. In this case, the SIS models are configured. From the exposed models, there are other derivations, such as SIRS or SEIRS. According to the characteristics of COVID-19, the SEIR model is found to be the most appropriate to be incorporated into the simulation.
Figure 1 - Visual representation of the SEIR model
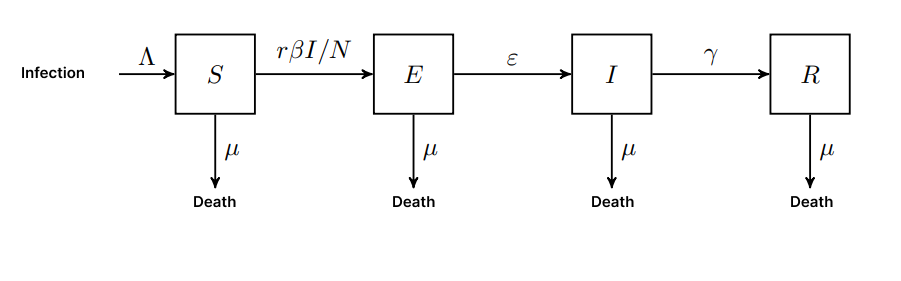
Source: Own Authorship (2023)
In addition, the SEIR model can be implemented analytically through differential equations presented in equations (1), (2), (3), and (4). In all the presented equations, 𝑡 refers to time in days.
E: Exposed (latent) humans
ε: Per capita rate of progression to infectious state
-
/ = Λ − β − µ γ − µ
-
/ = β − ε
-
/ = ε − γ − µ
-
/ = γ − µ
Figure 2 - Epidemiological dynamics of the SEIR model
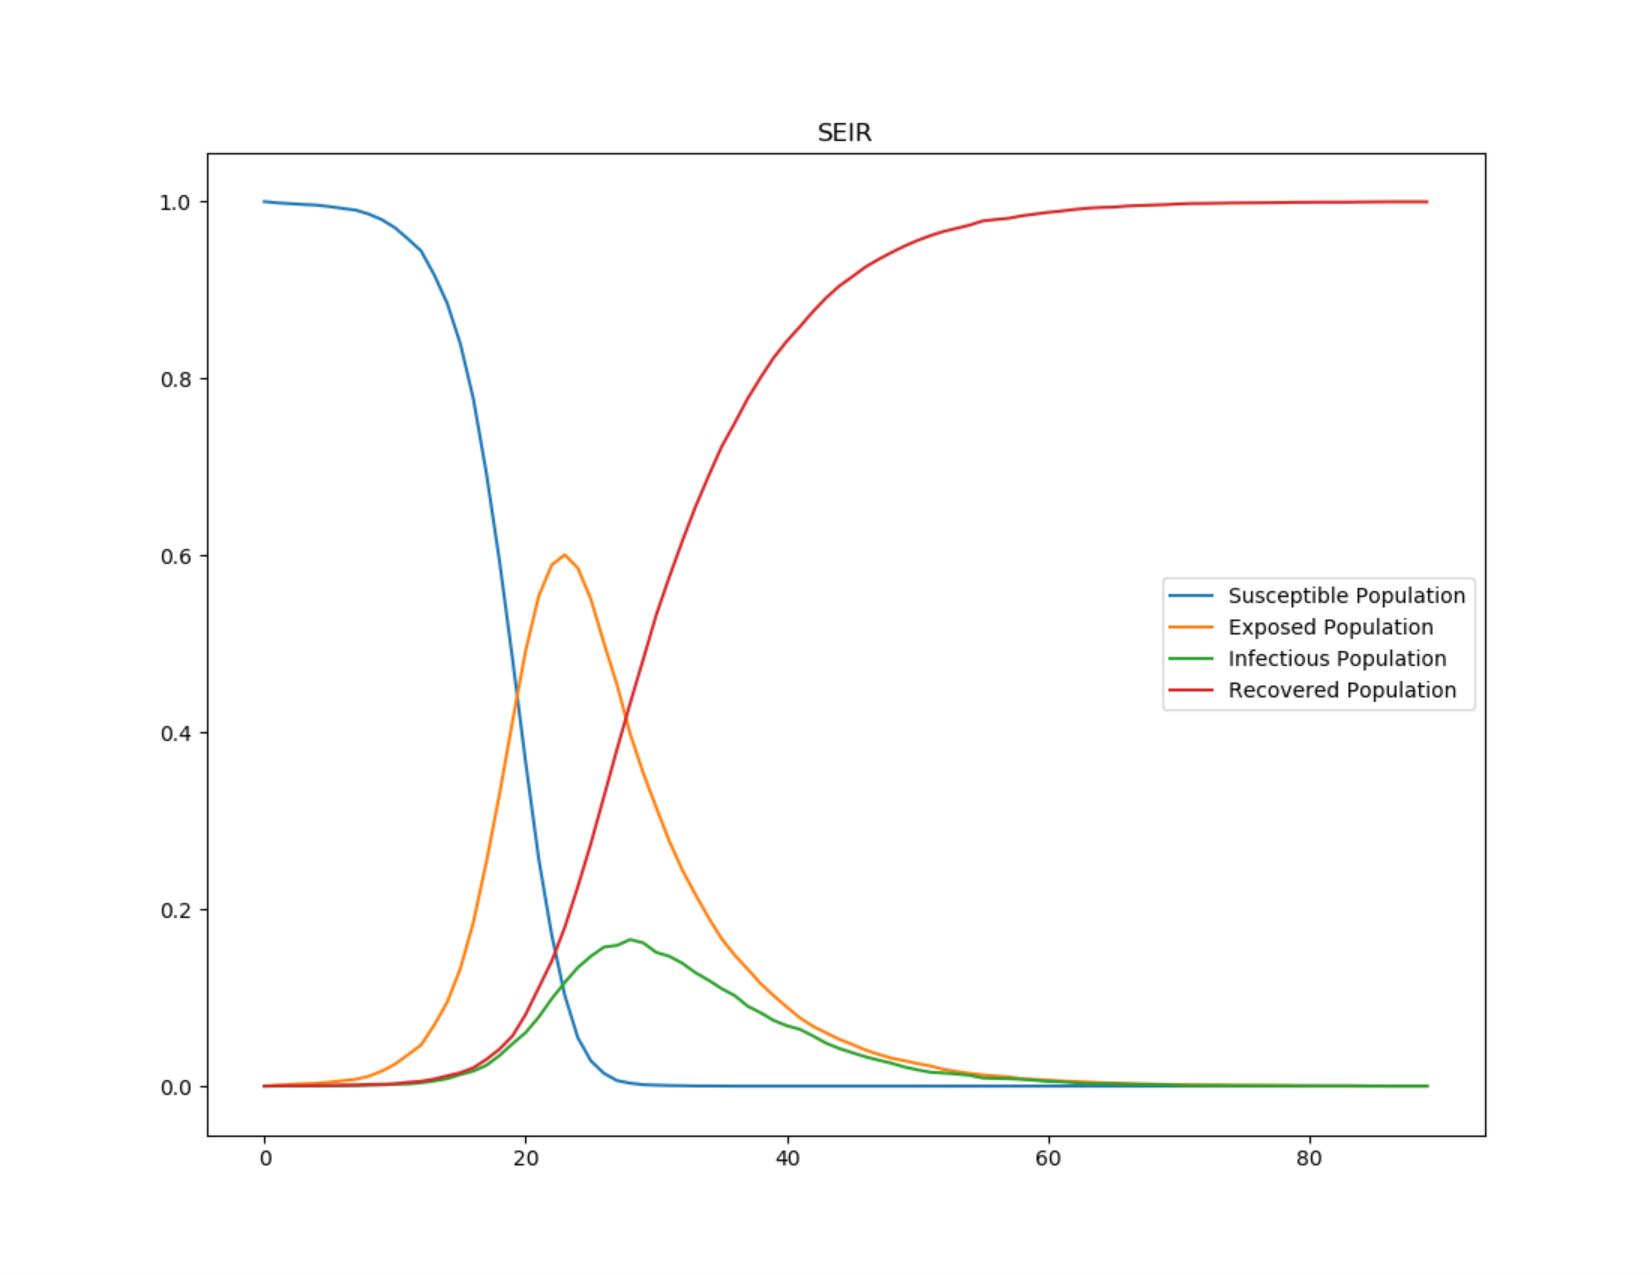
Source: Own Authorship (2023)
Relevant epidemiological concepts
Viruses are "on the brink of life and death" (ANDREWES, 1967). Under a microscope, a virus appears as a dead geometric crystal. However, when it makes a living cell its host, it can replicate rapidly.
A virus is essentially made up of two parts: genetic material and a protein capsule. In simplified terms, after infiltrating a cell, the virus rewrites the cell's DNA and transforms it so that it produces hundreds or even thousands of copies of itself. When these virus copies leave the affected cell, they become lifeless again until they enter another cell and the cycle is restarted. The cellular damage caused by the genetic rewriting process causes the disease. Figure 4 represents the infectious process of viral diseases.
Figure 3 - The relationship between virus infectivity and symptoms
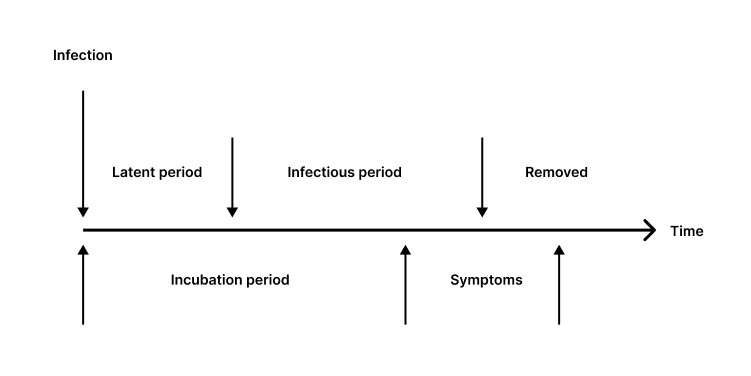
Source: Rhodes (1996)
The labels above the line in Figure 4 describe the host's infectivity, while those below the line describe the disease dynamics. Note that the infectious period may begin before or after the onset of symptoms.
-
Latent Period: This is the time interval during an infection in which the virus has not yet developed the potential to transmit to a new host.
-
Infectious Period: During this phase, the virus is contagious and can be transmitted to others using organic propagation mechanisms.
-
Recovered or Removed: In terms of viruses, a host who has developed natural immunity or died is no longer capable of contributing to the reproduction process. The virus, therefore, cannot reproduce in either scenario.
-
Incubation Period: At the beginning of an infection, there may be no signs of infection; this is known as the incubation period. Viruses reproduce most during the junction of this phase and the infectious period (RHODES, 1996). This is due to the fact that hosts are unaware they are infected, maintaining normal interaction with other potential hosts, who are still healthy.
-
Symptoms: This is the stage of infection when there are apparent indicators of infection. Treatment for viral infections usually consists of relieving symptoms and separating uninfected people.
Flattening the curve
In the context of infectious disease outbreaks, such as pandemics, "flattening the curve" has emerged as a critical technique for controlling and managing the spread of diseases. The goal of flattening the curve is to slow the rate of infection, minimize pressure on healthcare systems, and ultimately save lives.
The phrase "flattening the curve" refers to an epidemiological curve, often graphically represented, which shows the number of new cases of an infectious disease over time. In an uncontrolled outbreak, the curve exhibits a rapid and sharp rise, indicating a significant increase in the number of infections in a short period of time. This sharp curve implies a significant burden on healthcare systems, potentially overwhelming hospitals and leading to an increase in severe cases and deaths.
Figure 4 - Graph of flattening the curve
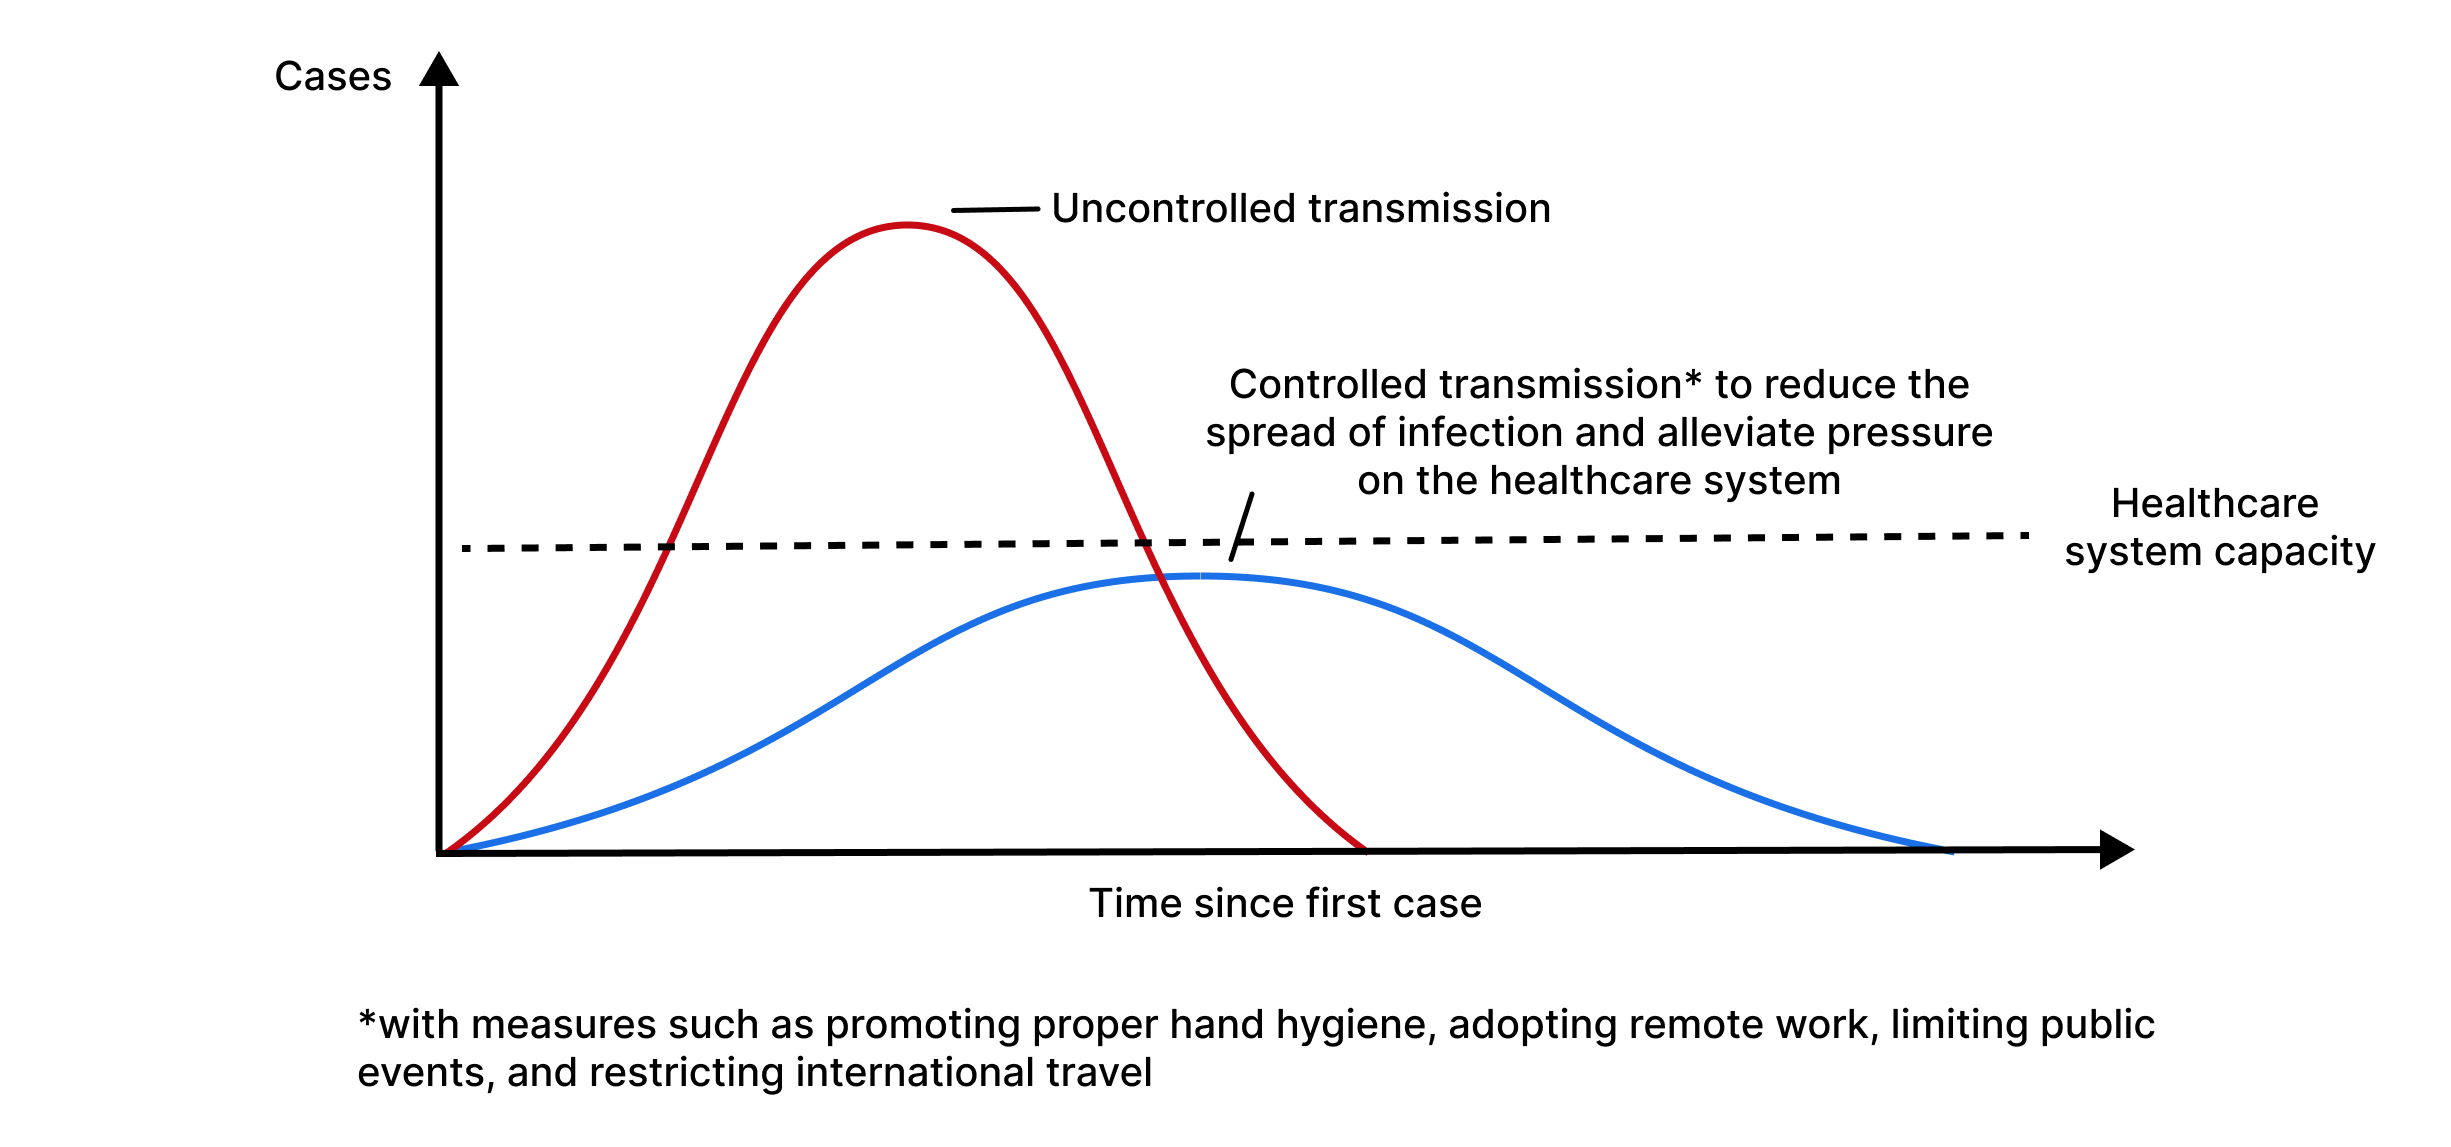
Source: Daud (2022)
"Flattening the curve" aims to address the challenges posed by a sharp epidemiological curve. The main goals of this strategy include:
- Slowing the spread: The curve can be flattened by applying measures to reduce the rate of transmission, such as social distancing, wearing masks, and hygiene practices. Slowing the disease spread allows healthcare systems to better manage the flow of cases, ensuring that those who need medical attention receive adequate care.- Evitar a sobrecarga do sistema de saúde: Ao diminuir o número de novos casos por dia, a demanda por recursos de saúde, como leitos hospitalares, ventiladores e equipe médica, pode ser adiada por um período de tempo mais longo. Isso evita que os sistemas de saúde fiquem sobrecarregados, permitindo que eles ofereçam um melhor atendimento ao paciente e melhorem os resultados gerais.
- Preventing healthcare system overload: By decreasing the number of new cases per day, the demand for healthcare resources, such as hospital beds, ventilators, and medical staff, can be spread over a longer period. This prevents healthcare systems from being overwhelmed, allowing them to provide better patient care and improve overall outcomes.
Prevalence and incidence
In epidemiology, prevalence is defined as the proportion of the population with a condition at a specific moment (point prevalence) or over a period (period prevalence) (KIER, 2011). Prevalence increases when new cases of disease are identified (incidence) and decreases when a patient is cured or dies. Often, period prevalence will provide a more accurate picture of overall prevalence because it includes all individuals with the disease between two dates: old and new (incident) cases, as well as those who were cured or died during the period (WHITING, 2015).
Analysis of virus behavior in different environments
Various factors influence the spread of the virus in a particular environment, such as social, economic, hygienic, and atmospheric factors, in addition to the characteristics of the virus itself. To address the behavior of COVID-19, we first need to understand its transmission model.
COVID is primarily transmitted by small droplets produced when an infected person talks, coughs, or sneezes, many of which can remain suspended in the air for minutes to hours. Touching contaminated surfaces or objects is possibly a way of spreading COVID, but the Centers for Disease Control and Prevention (CDC), an agency of the United States Department of Health and Human Services, believes that the main way of spread is from person to person through respiratory droplets. Therefore, in this research, we focus mainly on the risk of droplets expelled into the air.
Reference interaction
We start by estimating the risk of interacting with a single COVID-19 positive person indoors for 1 hour at a normal socialization distance of 1 meter during a normal volume conversation.
Activity risk: Talking with 1 person with COVID-19, for 1 hour, indoors, without a mask, at 1 meter = 14%
For this estimate, studies of passengers on trains (HU et al., 2021), aerosol transmission models (JIMENEZ, 2022), using contact tracing data, meta-analyses (CHU et al., 2020), and prospective studies (CHENG et al., 2020) were combined. From this estimate, the 14% can be multiplied by 1.5x based on the increased contagion of the B117 variant (DAVIES et al., 2013) and again by 1.5x as a consequence of the Delta variant (DAVIES et al., 2013).
This defines a "reference interaction," which will be used as a starting point to estimate the risk of other types of interactions.
Modifiers
There are various modifiers for the risk of activity, such as mask usage, being outdoors, ventilation, distancing, among others. These factors influence the probability of virus spread and must be analyzed.
To estimate the risk of activity from different interactions, we modify our estimate based on how the interaction in question differs from the reference interaction above, based on the following factors:
- Duration of the interaction
- Masks
- Location (outdoor or indoor)
- Distance between individuals
- Volume of conversation
The estimates for these modifiers are:
Table 1 - Modifiers in the risk of contracting COVID-19
| Modifier | Change in the risk of contracting COVID-19 |
|---|---|
| I am wearing a surgical mask | / 2 |
| Another person is wearing a surgical mask | / 4 |
| External environment | / 20 or more |
| 2 meters distance | / 2 |
| For each additional meter of distance (up to 4 meters) | / 2 |
| Speaking loudly (yelling, talking over music, singing) | x 5 |
| Not speaking (such as riding a train) | / 5 |
Source: Adapted from Lindsley et al. (2020), van der Sande et al. (2008), Davies et al. (2013), Jimenez (2022), Chu et al. (2020), Hu et al. (2021), Hua et al. (2020), Lai et al. (2012), O'Kelly et al. (2020), and Steinhauer (2020)
Masks
Most sources are drawn from An Evidence Review of Face Masks against COVID-19 (HOWARD et al., 2021), which examines a variety of study types, some specific to COVID-19 and others that study particle filtering as a property of the fabric or for other pathogens, such as influenza.
The estimate begins with a numerical reduction in contamination for each aspect of surgical masks. The table below shows the various results of these studies:
Table 2 - Characteristics of surgical masks and the respective reduction in pathogen contamination
| Measure | Result |
|---|---|
| Proportion of cough aerosol blocked | 60% (1.7x reduction) |
| Protection factor | 2.5x |
| Reduction of viral copies | 3.4x |
| Reduction of "fine" aerosols | 2.8x |
| Reduction of "coarse" aerosols | 25x |
| Reduction of colony-forming units | 7x |
| Proportion of airflow leakage around the mask | 12% (Maximum protection of 8x) |
| Reduction in cough droplet count | 10x |
Source: Adapted from Lindsley et al. (2020), van der Sande et al. (2008), Milton et al. (2013), Davies et al. (2013), Kumar et al. (2005), and Fischer et al. (2020)
It is concluded that surgical masks are substantially better at blocking large particles (25x) than small particles (2.8x) (MILTON et al., 2013). Coughing seems to be filtered extremely efficiently (DAVIES et al., 2013) and (FISCHER et al., 2020), which implies that they are mainly large particles. As a result, a slightly higher number than the total value cited in Influenza Virus Aerosols in Human Exhaled Breath: Particle Size, Culturability, and Effect of Surgical Masks (MILTON et al., 2013), (3.4x), is set at 1/4.
Estimates are obtained for thin and thick cotton masks which offer less protection to others, comparing them with surgical masks and among themselves. A "scarf" is approximately 56-65% as protective as a surgical mask, while a "cotton blend" is approximately 70-78% as protective (DAVIES et al., 2013)
A homemade mask is approximately 92% as effective as a surgical mask in blocking colony-forming units (DAVIES et al., 2013). Overall, a thick, well-fitting cotton mask is about 80% to 90% as effective as a surgical mask (which according to estimates reduces exposure by 4x), resulting in 2.5x-3x protection, which we round up to 3x (1/3 multiplier) for thick cotton masks. As a result, a thinner or poorly fitting homemade mask appears to be at least 50% as effective as a surgical mask, which we round to 2x (1/2 multiplier).
Vaccination
In an unvaccinated population, 17% of cases never show symptoms, and these individuals are 42% more likely to transmit COVID than those who eventually show symptoms (BYAMBASUREN et al., 2020).
From this, it is calculated that for every infection, there are 0.83 symptomatic infections and 0.17 asymptomatic infections, or for every symptomatic infection, there are approximately 0.2 asymptomatic infections. Only the vaccine brands administered in Brazil will be studied, including AstraZeneca, Pfizer, CoronaVac, and Johnson & Johnson, along with their infectivity rates and efficacy.
AstraZeneca
The AstraZeneca trial study conducted by the University of Oxford in 2021 reported that among fully vaccinated participants, there were 57 asymptomatic cases and 84 symptomatic cases, or 0.68 asymptomatic cases per symptomatic case.
There was a 59.8% reduction in symptomatic COVID cases among fully vaccinated individuals with the AstraZeneca vaccine (BERNAL et al., 2021).
For every symptomatic case among unvaccinated people, this gives us:
Table 3 - Analysis of AstraZeneca vaccine efficacy
| Control Group | Vaccinated Group | |
|---|---|---|
| Symptomatic cases | 1 | 0,4 |
| Asymptomatic cases | 0,2 | 0,4*0,68 = 0,27 |
Source: Adapted from Byambasuren et al. (2020)
Treating asymptomatic cases as having 0.4 relative infectivity, this results in an adjusted infectivity rate of:
(0, 4 + 0, 4 * 0, 27) / (1 + 0 , 4 * 0, 2) = 0, 47
Pfizer
Pfizer showed a 95% reduction in symptomatic COVID cases (POLACK et al., 2020). The CDC showed that there was a 90% reduction in all cases (symptomatic + asymptomatic) 14 or more days after participants received the Pfizer vaccine (THOMPSON et al., 2021).
Then, the number of asymptomatic cases among vaccinated individuals is recalculated based on these studies:
- For each symptomatic case among unvaccinated people, there are 0.2 asymptomatic cases, or 1.2 cases in total (BYAMBASUREN et al., 2020)
- For each symptomatic case among unvaccinated people, there are 0.05 symptomatic cases among vaccinated.
- For each total case among unvaccinated people, there are 0.1 total cases among vaccinated people (CDC).
- For each symptomatic case among unvaccinated people, there are 1.2 * 0.1 = 0.12 total cases.
- For each symptomatic case among unvaccinated people, there are 0.12 - 0.05 = 0.07 asymptomatic cases among vaccinated people.
- For each symptomatic case among vaccinated people, there are 0.07 / 0.05 = 1.4 symptomatic cases among vaccinated people.
Then, this is combined with the study by Bernal et al., which found that the Pfizer vaccine is 87.9% (95% confidence interval: 78.2 to 93.2) effective in reducing the chance of symptomatic infection by the Delta variant.
Table 4 - Analysis of Pfizer vaccine efficacy
| Control Group | Vaccinated Group | |
|---|---|---|
| Symptomatic cases | 1 | 0,12 |
| Asymptomatic cases | 0,2 | 0,12 * 1,4 = 0,17 |
Source: Adapted from Byambasuren et al. (2020) and Bernal et al. (2021)
Treating asymptomatic cases as having 0.4 relative infectivity, this results in an adjusted infectivity rate of:
(0, 12 + 0, 4 * 0, 17) / (1 + 0, 4 * 0, 2) = 0, 17
CoronaVac
Among vaccinated participants, 51 tested positive for SARS-CoV-2 during follow-up (41 before and 10 after the second dose); 29 were diagnosed through asymptomatic screening, giving us 0.56 asymptomatic cases per symptomatic case (TANG et al., 2021)
No symptomatic positive cases or known exposure occurred more than 7 days after the second dose. Unvaccinated participants had a higher cumulative incidence of positive test results compared to vaccinated participants and a higher incidence of positive test results through asymptomatic screening, for symptoms or for known exposure.
For each symptomatic case among unvaccinated people, this gives us:
Table 5 - Analysis of CoronaVac vaccine efficacy
| Control Group | Vaccinated Group | |
|---|---|---|
| Symptomatic cases | 1 | 0,4 |
| Asymptomatic cases | 0,2 | 0,4 * 0,56 = 0,224 |
Source: Adapted from Byambasuren et al. (2020)
Treating asymptomatic cases as having 0.4 relative infectivity, this results in an adjusted infectivity rate of:
(0, 4 + 0, 4 * 0, 224) / (1 + 0, 4 * 0, 2) = 0, 45
Johnson & Johnson
Johnson & Johnson conducted serological tests for antibodies unrelated to the spike protein on days 1, 29, and 71 to track asymptomatic infections. They also considered an asymptomatic infection if a participant had a positive PCR test but no symptoms. Symptomatic cases were accounted for when a patient had symptoms and tested positive on the PCR at least 14 days after the administration of the vaccine.
Table 6 - Analysis of Janssen vaccine efficacy
| Control Group | Vaccinated Group | |
|---|---|---|
| Symptomatic cases | 1 | 0,36 (J&J Fase 3) |
| Asymptomatic cases | 0,2 | 0,36 * 0,18 = 0,065 |
Source: Adapted from Byambasuren et al. (2020)
Treating asymptomatic cases as having 0.4 relative infectivity, this results in an adjusted infectivity rate of:
(0, 36 + 0, 4 * 0, 065) / (1 + 0, 4 * 0, 2) = 0, 36
Hospitalization and death rate by age group
To more accurately represent the probability of COVID-19 contamination in the population, the susceptibility of each individual to contract the disease must be considered. Factors such as chronic health conditions/diseases (diabetes, heart diseases, lung diseases, etc.), age, and gender influence both the likelihood of contracting the disease and the rates of hospitalization and death (ASLANER, 2021).
Table 7 - Hospitalization and death rate by age group
| Hospitalization rate (%) | Death rate (%) | |
|---|---|---|
| 0-17 years | 0.8% | 0.0015% |
| 18-49 years | 2.5% | 0.07% |
| 50-64 years | 7.9% | 0.7% |
| 65+ years | 5% | 6% |
Source: Adapted from Aslaner et al. (2021)
Methodology
Procut criteria
- The characteristics of the population, city, and activities that make up individuals' routines can be altered, deleted, or added to the simulation by a user-friendly interface;
- Each individual has their own characteristics that differentiate them from others, such as age, sex, home, school, and/or work, which are defined from the census of the city to be simulated;
- A neural network-like algorithm that distributes these unique characteristics to all individuals in the simulation intelligently;
- A virus dissemination algorithm that can determine a probability of infection based on the state of individuals, their environment, and disease characteristics;
- All individuals have their own routine with a series of pre-defined activities based on their characteristics;
- It is possible to change disease combat variables, thus resulting in different pandemic scenarios.
Materials used
For exploratory data analysis and graph creation, libraries from the Python programming language were used in conjunction with Jupyter Notebook, due to its easy use and a range of quite accessible functionalities.
For the simulation, the TypeScript programming language was used, which has a very popular ecosystem, whose community and libraries serve as facilitators of the development process. Moreover, since it is derived from JavaScript, the simulation can be converted so that it can be performed on any website without major complications.
Software
- Integrated Development Environment (IDE);
- Numpy and Pandas matrix and vector processing libraries;
- Matplotlib and Plotly data visualization and graph creation libraries;
- Bun execution engine.
Hardware
- Personal computer 1
- AMD Ryzen 5 5th generation processor;
- 24 GB of RAM;
- Windows 11;
- Storage on 512 GB M.2 NVMe SSD + 1TB HD.
- Personal computer 2
- Intel i5 8th generation processor;
- 8 GB of RAM;
- Windows 11;
- Storage on 480 GB SATA SSD.
- Personal computer 3
- Intel i7 10th generation processor;
- 8 GB of RAM;
- Windows 11;
- Storage on 256 GB PCLe SSD.
- Institutional computer
- Apple M1 processor;
- 16 GB of RAM;
- macOS Ventura;
- Storage on 512 GB M.2 NVMe SSD.
Steps
Virtual representation of the city
Representing a city virtually with accuracy and reliability is a challenge. Therefore, we chose to abstract the general dynamics of a city, based on the geographical concepts of fixity and flows. Fixities refer to the static elements of the city, such as buildings, roads, and other infrastructures, which are the permanent components that form the physical skeleton of the city. On the other hand, flows represent dynamic elements like the movement of people, vehicles, and information. These flows are crucial for determining the daily functioning of a city (BARROS, 2020).
In our modeling approach, we aim for a simplified representation that captures the essence of these two aspects. Although we focus on basic infrastructure and main movements within the city itself, we chose to simplify or omit certain more complex aspects, such as individual movements between neighboring cities. This simplification helps keep the model manageable and focused on the most critical aspects of urban dynamics.
In abstracting the city's representation, one approach is to create an a x b cell matrix, with each cell equivalent to 1m² of the actual city being used as the geographic location of an individual. We decided against this approach because it would waste memory in a state where a certain cell is not occupied by any individual. Instead, each individual has in their attributes the abstraction of location; they do not have defined coordinates but rather a state indicating their place. For example, in a city with 30,000 work points, when an individual is working, they do not have the exact coordinates of their job, but rather an identification, which is distinct from the other 30,000. Thus, when calculating virus spread in this environment, we look among the database of individuals for all those who, at that moment, have the same work point identification as the current individual.
To simulate the city, it is necessary to have the social and universal census of the place to obtain certain crucial information for the model. Due to the unavailability of recent data, the 2010 census from the Brazilian Institute of Geography and Statistics (IBGE) was used. We alert to the fact that, since the data refer to a city ten years in the past relative to the one that faced the COVID-19 pandemic, the results of deaths and cases may suffer minimal inconsistencies.
The requested information is important in defining the characteristics of individuals, their routines, and the rate of virus dissemination. Due to minor inconsistencies in the data obtained from the 2010 IBGE census, it was necessary to develop an algorithm to normalize the data.
Virtual representation of the city population
Each individual within the city is assigned certain activities at random based on their defined sociodemographic characteristics. These activities involve movement and interaction with other individuals and may categorize scenarios of leisure, work, or study, representing the daily routine of the individual in the city.
In addition to routines and their own characteristics, it was necessary to distribute the population across their respective residences to establish work-home or school-home routines.
Residences were allocated based on IBGE data as well as the number of individuals per residence. The age of these individuals was also considered in this distribution since there are related parameters. For example, it is unlikely that a scenario in which an individual aged zero to four years lives alone in a residence.
Thus, the virtually modeled population reflects detailed characteristics analogous to real life. Therefore, each individual possesses the following attributes properly distributed according to available data, in a coherent and relevant manner:
Individual attributes
- Identification;
- Gender;
- Age range;
- Educational status;
- Residence:
- Identification;
- Region;
- Number of residents;
- Other residents.
- Income;
- Transportation means (public or private);
- Types of occupation (work and/or study);
- Occupations:
- Identification;
- Type (work and/or study);
- Number of individuals.
- Vaccine:
- Type;
- Doses.
- Mask wearing;
- Hospitalized?;
- Deceased?;
- Current COVID status?;
- Past COVID infection?;
- Routine - a set of activities consisting of:
- Identification;
- Category (leisure, chores, work, transport, study, etc.);
- Duration;
- Distance between individuals;
- Volume of individuals' voices;
- Environment (indoor or outdoor).
Neural network for pertinent demographics and activity assignment
In the virtual city simulation, a neural network is employed to assign both demographic characteristics and daily activities to each individual, ensuring a high degree of realism that mirrors actual population dynamics. This network uses a comprehensive set of input data, including sociodemographic profiles described above, to facilitate precise modeling of urban demographics.
The neural network responsible for distributing the characteristics and routines of the population is a feedforward type with a single hidden layer. It employs the backpropagation algorithm for training. The architecture consists of an input layer with 10 neurons, reflecting the various sociodemographic attributes like age, sex, income, etc. The hidden layer contains 20 neurons, enabling the network to capture complex patterns and interdependencies among the input data. The output layer comprises 10 neurons, each corresponding to specific attributes or activities, such as type of employment, educational activities, or leisure actions.
This approach enables the simulation to assign realistic attributes and behaviors to the virtual population with a fidelity that closely replicates real-world dynamics. By leveraging this high-resolution demographic and behavioral data, the simulation can provide actionable insights into how different demographic groups interact within urban settings. This high level of detail can be pivotal in public health crisis management, as it allows for the precise targeting of interventions and resources to specific neighborhoods or demographic groups based on simulated outcomes. Such targeted strategies are not widely implemented in current models, making this approach particularly innovative and valuable for planning and response activities in real-time scenarios.
Activity synchronization in the simulation
To ensure that activities in the simulation are executed at the correct times, and that future activities only begin once current ones have finished—preserving the logic that an individual cannot be in different places simultaneously—there is a need to implement a synchronization algorithm for these activities. Therefore, various computational and theoretical techniques have been explored to address this problem.
NP-hard and Johnson's algorithm
A problem is assigned to the NP (nondeterministic polynomial time) class if it can be solved in polynomial time by a nondeterministic Turing machine (BORWEIN, 1987). NP-hard problems can include decision problems, search problems, or optimization problems.
The Job-Shop Scheduling Problem (JSSP) is an NP-hard combinatorial optimization problem. The goal is to find the optimal schedule for allocating shared resources over time to concurrent activities in order to minimize the total time required to complete all activities.
In a JSSP, there are N jobs (J1, J2, ..., Jn) that need to be completed using a number of shared resources, commonly denoted as machines (M1, M2, ..., Mm). Each job has operations (o) that need to be completed in a specific order for the job to be finished. Operations must be completed on specific machines and require a processing time (p) on that machine (YAMADA, 1997).
S. M. Johnson's heuristic algorithm, or simply Johnson's Algorithm, is one of the solutions for the JSSP and operates as follows:
The job Pi has two operations, of durations Pi1 and Pi2, to be performed on machines M1 and M2 in that sequence.
-
List = { 1, 2, ..., N }, List L1 = , List L2 = .
-
Of all the available operation durations, choose the minimum.
If the minimum belongs to Pk1,
Remove K from List A. Add K to the end of List L1.
If the minimum belongs to Pk2,
Remove K from List A. Add K to the start of List L2.
-
Repeat step 2 until List A is empty.
-
Combine List L1 and List L2. This is the optimal sequence.
This algorithm inspired the approach logic for synchronization. All activities occurring at a given moment are in an ordered array (arrangement) sorted by the duration of the activities; i.e., the first indices of the array contain activities happening now and have the shortest duration among all others.
Whenever a new activity starts, it is added to the array and triggers the dissemination algorithm for it according to its characteristics and those of its individuals, changing their states according to the results of the dissemination.
The dissemination algorithm is triggered only once for each activity. At each moment, the activities at the beginning of the array are computed, their duration is added to the global simulation time, and they are removed from the array; this time is subtracted from all other ongoing activities. After this, a search is performed for all individuals to see if the activity they were involved in has finished and if they start a new one at that simulation time, and thus the array is sorted again. This strategy was chosen because the execution time of the program depends entirely on the speed of the dissemination, sorting, and search algorithms, and there is no need for an intentional bottleneck to alter the simulation time according to real time.
Use of theoretical foundations for calculating the probability of disease spread
The spread is an abstraction of the concept of cellular automata in Moore's Neighborhood: the health status of each individual is altered based on the data from virtually nearby individuals, given a fixed rule. This fixed rule is the calculation flow of the probability of disease spread.
This flow is thus carried out like a production line. Iteratively, the algorithm extracts all information starting from each characteristic and health status of the individuals, as well as characteristics of the activity, virtual environment, global parameters about the virus, its behavior, and probabilities of previously defined modifiers, such as the type of mask and vaccine. In this way, the probability of disease spread is determined using the activity risk rates, individual risk of each individual, and prevalence of cases in the region. All modifier values and examples of calculations are shown during the theoretical foundation. If this probability exceeds a minimum threshold yet to be stipulated, it is considered that the individual has contracted the disease.
Figure 5 - Simplified flowchart of the Pandemica's operation
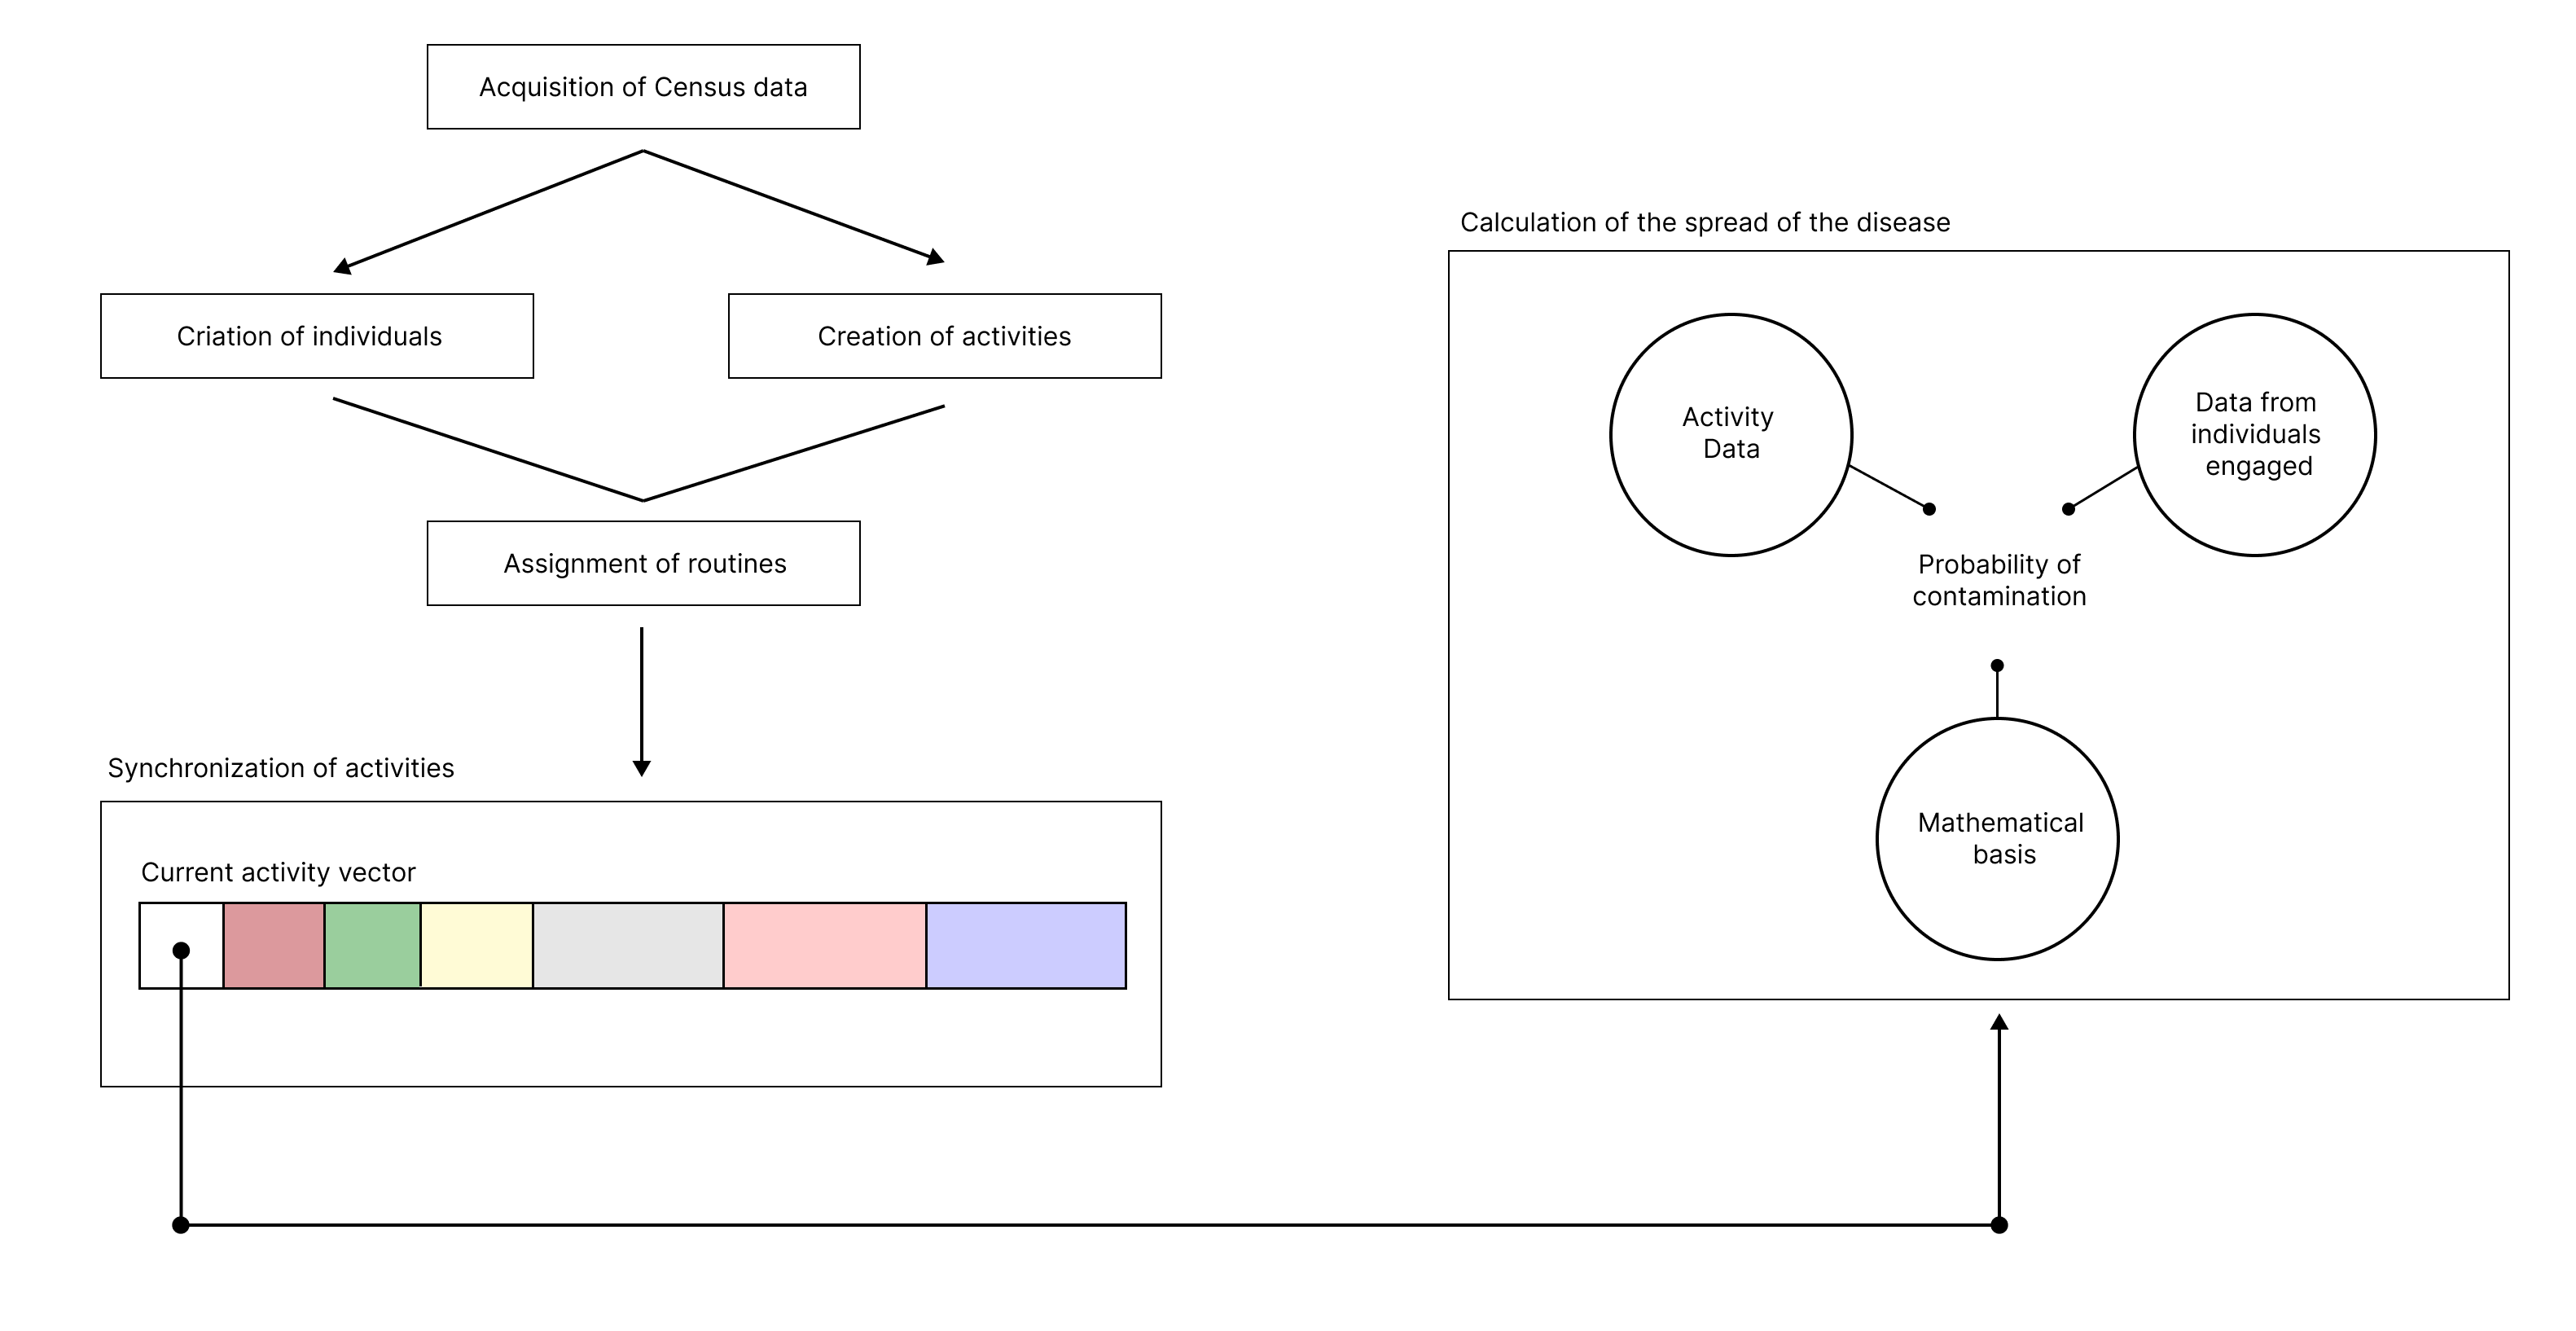
Source: Own Authorship (2023)
Model validation using COVID-19 data
To simulate different scenarios with varying configurations of mask usage, social distancing, and people traffic, we first need a model capable of replicating the actual numbers of deaths and cases under the exact conditions of the real pandemic scenario. We developed the following methodology for model validation:
Figure 6 - Methodology for dissemination model validation
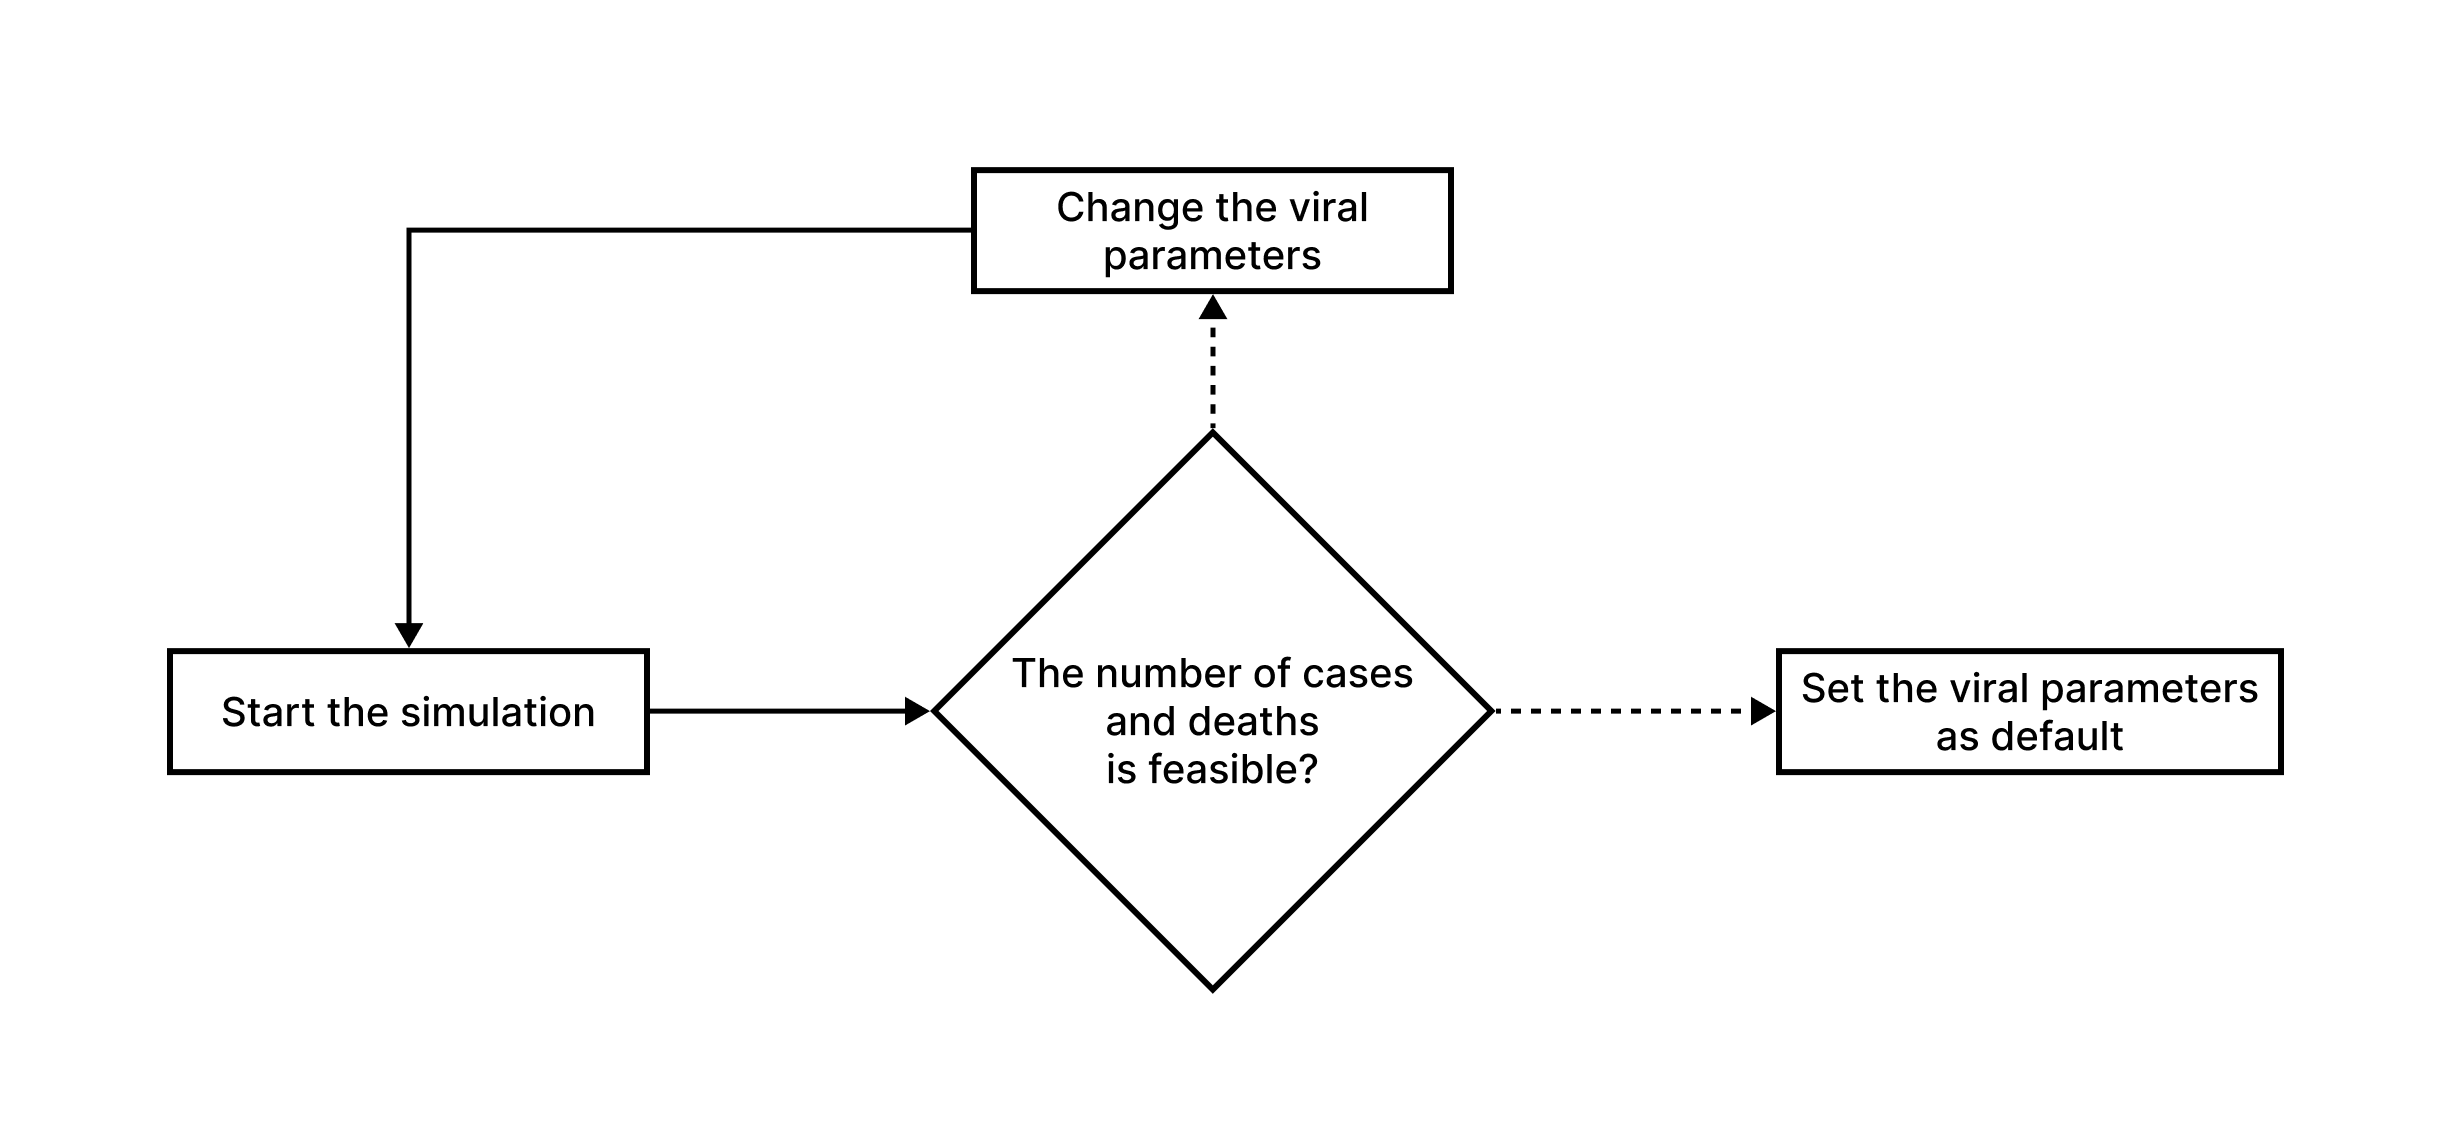
Source: Own Authorship (2023)
Before testing the model for simulating scenarios based on characteristics of potentially epidemic recent diseases, we first need to validate it using data from a past pandemic, such as COVID-19. Without this step, we cannot be certain if the simulated scenarios are accurate or not.
For validation, we use the Hold-out Validation method, which involves dividing the epidemiological bulletin datasets from 2020 to 2021 into training and testing sets, using an 80/20 ratio. The 20% of the data represents the first months of the pandemic in 2020 and is used to train the model, which then sets virus prevalence variables, case increase rates, among others, based on this data.
After incorporating the initial data, the model becomes self-sufficient, adjusting its rates and variables based on the cases it generates. At the end of the desired simulation period, we use the remaining 80% of the data to validate the accuracy of the predictions.
Results and Discussion
At the current stage of research development, the computational feasibility of modeling a virtual population with attributes, characteristics, and routines analogous to those of individuals in a real population has been demonstrated in theory and confirmed in practice, based on geographical and demographic data. However, implementing this model has proven to be challenging, requiring the consideration of a wide range of parameters to create a virtual population that is minimally related to the real one.
Moreover, our research has proven, to date, that it is computationally feasible to simulate a pandemic using cellular automata that represent individuals in a virtualized abstract city. This approach has the potential to provide valuable insights into how infectious diseases spread and how effective each type of intervention is.
As a partial result of this research, three years of the COVID-19 pandemic in Campinas from 2020 to 2023 were simulated, following the established bibliographic, theoretical, and methodological foundation. The charts bellow illustratively represent the results obtained from the modeling with the respective accuracy when compared to the actual data.
Loading...
The simulated scenario reflects the use of masks and vaccination of the population similar to what actually occurred during the pandemic. However, the simulated data shows an inflated number of cases and deaths compared to the actual data observed in Campinas during the same period. Specifically, the simulation resulted in 289,943 cases and 7,752 deaths, while in Campinas, about 209,500 cases and 5,360 deaths were recorded.
This discrepancy suggests the need for more testing and refinement of the model to increase its accuracy. It is important to improve the model not only in technical terms but also by exploring and better utilizing the attributes of each individual. After implementing such modifications and improvements, we expect to reduce the total number of cases predicted by the simulation, avoiding the virtual hyper-contamination that did not occur in reality.
Although the current model needs improvements, it already demonstrates potential to predict the behavior of new diseases and future epidemic scenarios. The focus should be on enhancing and polishing the model to ensure it can more accurately simulate the impacts of public health interventions, such as vaccination and mask usage, in different epidemic scenarios. As a final result, it is expected that the model will achieve an accuracy of 70% to 80%, surpassing current models that operate in the range of 30% to 40%.
Conclusions
From the initial goal of creating a model capable of simulating potentially pandemic diseases in any virtual scenario, the use of diverse data sources, mathematical grounding, theoretical computational concepts, and methods was proposed to achieve an accurate and reliable simulation model. Throughout this work, every aspect of the simulation, its feasibility, relation to interdisciplinary concepts, and the best way to implement it was thoroughly studied.
The conceptualization of such methods and their theoretical validation were completed, making it possible to establish a model theoretically capable of simulating a pandemic on a local scale, thus mitigating and reducing the impacts of a pandemic.
We attest to the fact that although the project deals with the characteristics of the COVID-19 virus in Campinas, the theoretical and methodological bases can and should be implemented and adapted to other diseases, mainly respiratory ones, and in any city that has some kind of geographic and demographic census.
It is also worth noting that we successfully proposed and implemented a pandemic simulator that appropriates a population with detailed municipal-level attributes, differing from more general national or state-level implementations, such as in "Outbreak diversity in epidemic waves propagating through distinct geographical scales" (COSTA; COTA; FERREIRA, 2020), and even municipal adaptations like the one proposed in "Modeling the Spatiotemporal Epidemic Spreading of COVID-19 and the Impact of Mobility and Social Distancing Interventions" (ARENAS et al., 2020), due to the novelty of a model aimed exclusively at the local scale with enriched demographic insights. Thus, the collection and use of regional data instead of macroscopic abstractions resulted in a more accurate and reliable model, with low computational power requirements.
Therefore, the use of a cluster of various simulators, each suitable for a single city according to census data, enables the simulation of state and national scales made up internally of structures more specific and directed to municipalities, which corroborates, consequently, for more accurate simulations in general.
As a result, from the ongoing research, we obtained a pandemic simulator that is not limited to the mathematical character of classic epidemiological modeling as seen in "Spreading phenomena on complex networks and social systems" (COTA, 2020), including a wide range of biological, geographical, and demographic parameters in a pioneering way. Thus, it constitutes a model that is capable of simulating and predicting the future behavior of potential pandemics, especially respiratory diseases, which can freely licensed and distributed to municipal or state health departments, as well as ministries and competent organizations, such as the Ministry of Health and the World Health Organization (WHO), enabling preventive actions to reduce the human, social, and economic impacts of an outbreak. In addition, public and/or private pharmaceutical sector companies can also benefit from testing the efficacy of their vaccines in virtualized pandemic scenarios, such as Pfizer, Johnson & Johnson, AstraZeneca, and Butantan.
Finally, we hope that this work inspires future efforts to refine the methods we proposed, as well as existing techniques, with the aim of further expanding the domain of new theoretical bases in the field of computational pandemic simulation. It may contribute to the development of more effective strategies for preventing and responding to pandemics in the future, for example, through machine learning on simulated scenarios, further elevating the conclusions to be made about the course of a pandemic.